


Most investors are still trying to recover from losses that occurred during the market crash of 2008. The decline in values was created by an unprecedented freeze in the availability of credit and lending, both between banks and to businesses. However the quick government response, especially in the U.S., renewed investor confidence and as a result a significant and uniform rebound in bond and stock prices occurred throughout 2009 and 2010. Unfortunately an economic recession developed, and many countries, especially in Europe, could not honour debt payments on loans, which had been allowed to increase over the years. While some recent progress has been made to reverse sovereign debt levels, Analysts believe that the widespread high government debt will be a tough opponent to both economic growth and market stability. Most of the risk seems to be centred in Europe and while there is some renewed optimism that the rest of the world will not be significantly affected, the consensus is that economic growth over the next few years may be lower than in the past and market volatility could remain high. Therefore individuals need to take this into account when setting expectations not just for the performance potential of their investment account(s) but also when setting retirement goals and objectives.
The Portfolio Recovery Strategy Program ™ (PRSP)
In December 2008 I announced the introduction of the “Portfolio Recovery Strategy Program.” ™ This service custom designed and rebalanced investment accounts with sensitivity to economic trends and evolving market cycles. While some fund managers used this strategy, active oversight at the Advisor level was a new experience for individual investors. Higher risk investments should be at their peak concentration as a recovery begins (at the bottom of the cycle) while lower risk investments should dominate a portfolio as the growth cycle matured and negative economic indicators surfaced. The risk is, of course, that a change made to an investment account allocation could not be timed properly which would negatively affect performance. However I have suggested over the years that an investment account was also threatened if risk levels were not reduced during the onset of a recession and a decline in market prices.
Recently this service has evolved to appoint outside Firms who offer tactical strategies. Their discretionary mandate provides a quicker response to adapt to market conditions.
Your Retirement Map ™ – New test level for Account Design
However another dimension needs to be added to “test” the design of your investment accounts especially since debt levels persist and various economic challenges remain. After all, the error that was made in 2007 and early 2008 was:
- the failure to recognize that a significant amount of risk had developed in the markets (and in investment accounts) over the preceding years, and
- the failure to test whether or not the amount of risk that existed in an investor’s portfolio was necessary to achieve their long term retirement income goals.
Therefore, a few years ago I developed a new program called “Your Retirement Map” ™. It’s purpose is twofold:
To provide realistic after-tax retirement income projections and
2. To determine if the amount of risk contained in your portfolio is necessary to achieve your retirement income needs.

Rate of Return Assumptions
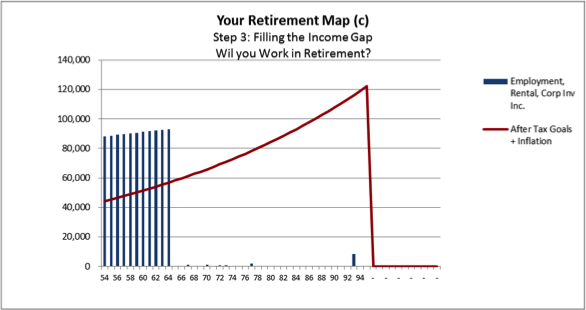
One of the key features of “Your Retirement Map” is that it will test if your future retirement income goals can be achieved without depleting your capital before the age of 95 by using a performance index that has a long history of low volatility. The Globe Canadian Bond Peer Index (see red columns in the chart below) has a five year (5) year volatility score of 3.2 and a ten (10) year rate of return of 4.2% (1).

Therefore either the historical record of this investment index or a flat rate of 4.5% will be used for illustrative purposes. This will invite a more reliable forecast and will establish, from today’s vantage point, the highest objective line for your future retirement income. However, a higher level of retirement income could be achieved if actual performance exceeds this mark and/or if different assumptions are used.
Notice the change in investment performance between 2008 and 2009 in the Globe Canadian Equity Peer Index (blue columns) in the chart below. In general, an investment account that is designed similar to this index has the potential to outperform one similar to Canadian Bonds. However the historical volatility is over 3 x that of the Globe Canadian Bond Index (red columns). Therefore if a higher rate of return is desired in your projections, it will be important to illustrate the performance and volatility similar to this index and test if your retirement capital and income goals can be sustained during a similar period of loss and recovery.
- Source: PalTrak as of December 31st, 2014
This is not to suggest that your performance goals or the amount of risk contained in your investment account(s) should change or that it is unwise to pursue a higher rate of return for your retirement savings. However your future retirement income security should also be managed by controlling expenses, maintaining regular savings and paying down debt, if possible, so that your after-tax income goals can be achieved without exceeding the maximum withdrawal that is recommended. If the actual performance in your portfolio exceeds what was budgeted this should be preserved to offset potential future losses.
 Your Retirement Map™ will also forecast your future retirement income on an after tax basis. Many factors will be used including your current account values, future savings plans, pension values, government benefits, your retirement date and your life expectancy to name just a few. I appreciate that so much can change in the future and the assumptions used to create this forecast will surely need to be adjusted on an annual basis. Our income tax rates today will change: inflation will not stay the same year over year; you may work longer or shorter than what you think today.
Nevertheless this program will give you a glimpse into your financial future. This process should also help verify the account design decisions that have already been made. Each year we will update your financial information; new goals entered; and another projection or “budget” will be established for the following years. With consistent annual reviews, you will have a guideline to follow to ensure the sustainability of your retirement income!
Notice to Reader: “This information is for illustrative purposes only. It is general in nature and does not represent investment advice or a solicitation to buy or sell any investments. Past performance is not necessarily a guide to future performance. Unit values change frequently and past performance may not be repeated. Information provided here may also contain projections or other “forward-looking statements” and there is significant risk that forward looking statements will not prove to be accurate and actual results, performance or achievements could differ materially from any future results, performance or achievements that may be expressed or implied by such forward-looking statements and you will not unduly rely on such forward-looking statements. This information is subject to change without notice and is based on the perspectives and opinions of the author at the time of the writing. Before acting on any of the above, please contact us for individual financial advice based on your personal circumstances “